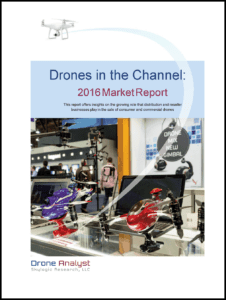
DRONES IN THE CHANNEL: 2016 MARKET REPORT
About: This 44-page research report provides a comprehensive view of drone distribution and sales in North America as of April 2016. It details U.S. market size for all drones and growth projections by segment (cost of drones, commercial activity, etc.), brand market share, types of reseller outfits and the roles they play, and the extent of big-box store penetration (what they carry, how many SKUs, etc.).
The report details the buyer’s purchasing experience and preferences, where and how do buyers purchase their drones (e.g., online or in a store) and the most popular drone brands by price point. It also details the buyer’s purchasing experience and preferences, where and how do buyers purchase their drones (e.g., online or in a store) and the most popular drone brands by price point.
[tabgroup]
[tab title=”Purchase” icon=””]
CONTACT US FOR PURCHASE
$295 for Single User License – A Single User License authorizes only the named user (one person) the right to access the purchased report. It grants the user the right to install the report on any number of machines as long as that same licensee is the only user. By choosing this option the named user agrees not to distribute the report.
$495 for Site License – A Site License authorizes the user to install the purchased report in several computers at a particular site or facility. The license allows simultaneous access to up to 25 users.
$795 for Enterprise License – An Enterprise License authorizes the entire population of a business entity (employees, on-site contractors, off-site contractors) access to the purchased report for up to two years from the date of purchase.
Pay by Credit Card or PayPal. Select the license option and then click “Add to Cart” below. At checkout use the gray button if you do not have a PayPal account.
Note: We do not sell to foreign purchasing agents or freight forwarders. The research report will be sent to the email address you provide in PayPal checkout. Allow 24 – 48 hours for delivery. If you do not receive the report within that time, please check your Spam or Bulk E-Mail folder before making an inquiry.
CALL US FOR PURCHASE![]()
[/tab]
[tab title=”Table of Contents” icon=””]
LIST OF FIGURES
LIST OF TABLES
EXECUTIVE SUMMARY
ABOUT THIS STUDY
Background
Objective
Methodology
KEY INSIGHTS
Insight 1
Insight 2
Insight 3
Insight 4
Insight 5
Insight 6
Insight 7
Insight 8
DRONE MARKET GROWTH
Size of drone market and growth
Size and growth by FAA weight segment
Price / market segments
FAA Section 333 exemptions – growth and drone statistics
DISTRIBUTION BUSINESSES AND THE ROLES THEY PLAY
Manufacturers selling direct to consumers
Manufacturers selling direct to retail chains
Drone-specific distributors
General or traditional distributors
Vertical market distributors and resellers
Storefront drone-specific dealers
Estimate of number of retail outlets carrying drones
Distribution networks of major manufacturers (original interviews)
Wholesale or direct?
Just drones?
Services offered?
Hottest segments and outlets?
What’s next?
BUYER SURVEY RESULTS
Demographics
Place of purchase by channel business (last and next purchase)
How purchased
Buyer’s experience
Seller services that matter most
Brands purchased
Intended use
Price points
Drones costing less than $1,000
Drones priced between $1,000 and $2,000
Drones costing more than $2,000
Most popular accessories
ABOUT SKYLOGIC RESEARCH
ABOUT BZ MEDIA
APPENDIX: BUYERS SURVEY QUESTIONS
FIGURE 1 – U.S. CONSUMER DRONES UNIT SALES (in 000’s)
FIGURE 2 – PROJECTED U.S. DRONE SALES REVENUE (IN 000’s)
FIGURE 3 – AUTHORIZATIONS GRANTED VIA SECTION 333 EXEMPTIONS
FIGURE 4 – FAA SECTION 333 INTENDED OPERATION BY INDUSTRY
FIGURE 5 – TOP FAA SECTION 333 REGISTERED DRONE BRANDS
FIGURE 6 – NUMBER OF BRANDS CARRIED BY MAJOR RETAILER
FIGURE 7 – QUALIFIED RESPONDENT BY COUNTRY
FIGURE 8 – QUALIFIED RESPONDENT ROLE(S)
FIGURE 9 – QUALIFIED RESPONDENT BY AGE GROUP
FIGURE 10 – WHERE DRONE BUYERS BUY
FIGURE 11 – HOW DRONES ARE PURCHASED
FIGURE 12 – DRONE BUYING EXPERIENCE
FIGURE 13 – MOST IMPORTANT SELLER SERVICES
FIGURE 14 – BRAND PURCHASED
FIGURE 15 – INTENDED USE DETAIL
FIGURE 16 – INTENDED USE BY FAA UAS TYPE
FIGURE 17 – DRONE PURCHASE PRICE POINTS
FIGURE 18 – INTENDED USE FOR DRONES COSTING LESS THAN $1,000
FIGURE 19 – INTENDED USES FOR DRONES $1,000 – $2,000
FIGURE 20 – INTENDED USE FOR DRONES COSTING MORE THAN $2,000
FIGURE 21 – MOST POPULAR DRONE ACCESSORIES
LIST OF TABLES
Table 1 – 2016 Drone Forecast by Weight Segment
Table 2 – Drone Price / Market Segments
Table 3 – Ten Most Prominent Brands in Retail
Table 4 – Top Drone Brands Costing less than $1,000
Table 5 – Purchase Location for Drones under $1,000
Table 7 – Top Drone Brands $1,000 – $2,000
Table 8 – Top Drone Brands Costing more than $2,000
Table 9 – Purchase Location for Drones Costing more than $2,000
[/tab]
[/tabgroup]

